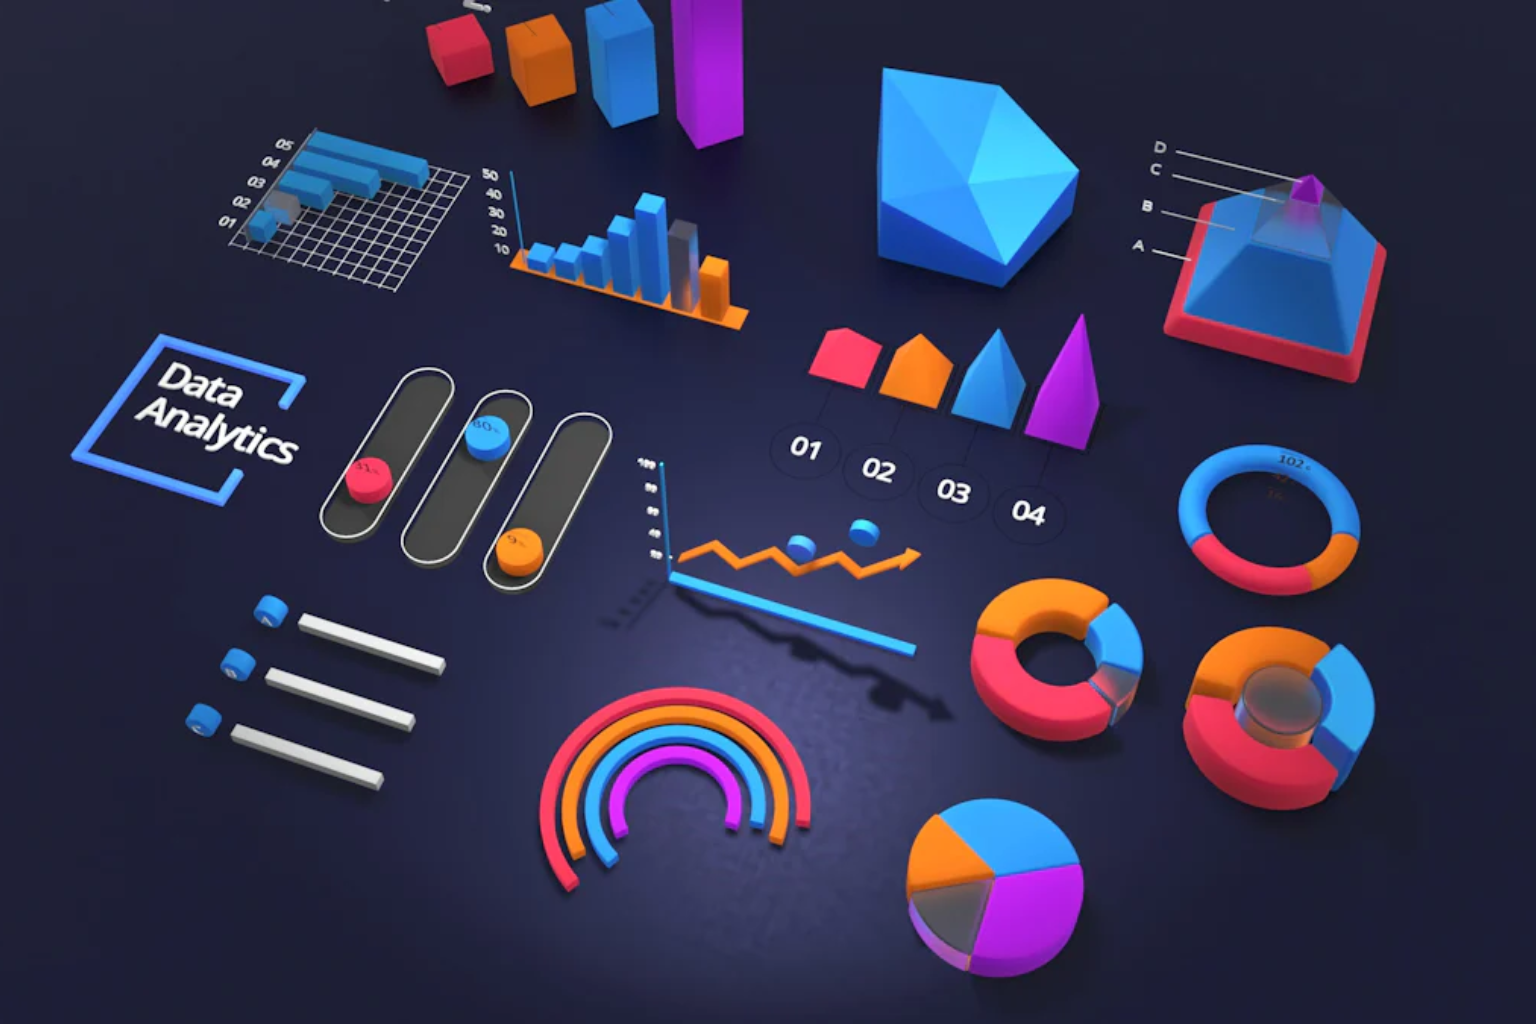
In the age of information overload, presenting complex data in a clear and engaging way is more important than ever. Infographics offer a visually compelling method to distill large amounts of information into easy-to-understand visuals. From corporate reports to marketing presentations, the right infographic can turn dense data into a story your audience will remember.

Why Visuals Beat Text in Data Communication
Studies from Forbes show that visuals are processed 60,000 times faster than text. This makes infographics an essential tool for businesses that need to present data quickly and effectively.
Complex reports often overwhelm readers with numbers and jargon. Visual representation simplifies comprehension without losing accuracy.
Infographics combine charts, icons, and concise text to deliver key messages instantly.
For internal communications, they help decision-makers grasp important metrics without wading through dozens of pages.
They’re also perfect for external presentations, keeping clients engaged while delivering data-driven insights.
Businesses that use infographics see improved audience retention and better engagement in both online and offline formats.
Learn how Mahi’s Graphic Design Services can help you create visuals that make data unforgettable.
The Role of Infographics in Marketing Campaigns
Marketing thrives on storytelling, and infographics are powerful storytellers for data-heavy messages.
They turn survey results, product statistics, and market trends into shareable, engaging content.
Infographics work exceptionally well on social media, where attention spans are short.
By condensing reports into visual highlights, you can boost click-through rates and audience interest.
Marketers can also repurpose infographic content into blog posts, videos, and presentations.
External sources like HubSpot confirm that infographics are among the most-shared forms of content online.
Combine visuals with Mahi’s Content Marketing Services to drive higher campaign ROI.
Simplifying Technical Reports for Non-Experts
Industries like healthcare, finance, and technology often rely on data that is complex and highly technical.
Infographics help break down these details for audiences who may not have specialized knowledge.
For example, a biotech company could use visuals to explain clinical trial results in layman’s terms.
By using color coding, icons, and simplified charts, comprehension rates improve dramatically.
This makes infographics valuable for investor reports, regulatory updates, and public education.
Infographics can also be interactive, allowing users to explore data points relevant to them.
Explore Mahi’s Data Visualization Solutions for your technical reporting needs.
Boosting Employee Training and Internal Communication
Training materials overloaded with text often fail to hold employees’ attention.
Infographics help by summarizing key steps, workflows, and safety protocols visually.
This is especially useful for onboarding new hires who need to absorb large amounts of information quickly.
Internal newsletters can also benefit from visual summaries of company performance metrics.
External examples from SHRM highlight how visual aids improve workplace learning outcomes.
Infographics ensure consistency in messaging across departments.
Partner with Mahi’s Corporate Training Design Services for effective employee learning tools.
Infographics for Investor and Stakeholder Reports
Stakeholders want concise, visually appealing updates on business performance.
Infographics allow you to present KPIs, market growth, and strategic milestones effectively.
They help busy executives and investors quickly interpret your data without sifting through lengthy documents.
Graphs, timelines, and progress indicators make quarterly updates more impactful.
Well-designed visuals also enhance brand credibility during investor presentations.
Case studies from McKinsey emphasize the importance of clarity in corporate communications.
Let Mahi’s Investor Report Design Services turn your data into persuasive visuals.
The SEO Benefits of Infographic Content
Infographics aren’t just for presentations — they can boost your online visibility.
When shared on blogs and social media, infographics attract backlinks, improving SEO rankings.
They increase dwell time on your site by engaging visitors longer.
Embedding keywords in accompanying text helps search engines index your content effectively.
External studies from Moz confirm that visual content performs better in SERPs.
Infographics can also be part of guest posting strategies to reach wider audiences.
Boost results with Mahi’s SEO Services integrated with your visual marketing.
Best Practices for Creating Effective Infographics
Start with a clear goal — decide exactly what you want your audience to take away.
Keep text minimal and focus on visuals to convey the message.
Use consistent branding, colors, and typography for a professional look.
Ensure data accuracy by verifying all sources before design.
Test your infographic with a small audience to check comprehension and appeal.
Optimize file size for web use to ensure fast loading times.
Get expert help from Mahi’s Infographic Design Team to ensure professional quality and impact.


